|
|
FT-SE100 BREAKS 7000 LEVEL FOR THE FIRST TIME IN HISTORY
Nobody seems to be noticing the boring old FT-SE100 index made an all time high yesterday breaking 7000 for the first time.
For most of my trading memory this index has been rangebound between 3500 and 6800 while many other world barometer indices has been enjoying the freedom of regular new high ground.
Talking to Robert Newgrosh of Newskills a while back he told me he has a long term target of 10,000 for this market based on his method of projections using point and figure charts and a formula which was I believe developed by himself and / or Jeremy Du Plessis of Indexia research. Both men are very good technicians and have done much work to enhance charting methods using point and figure charts.
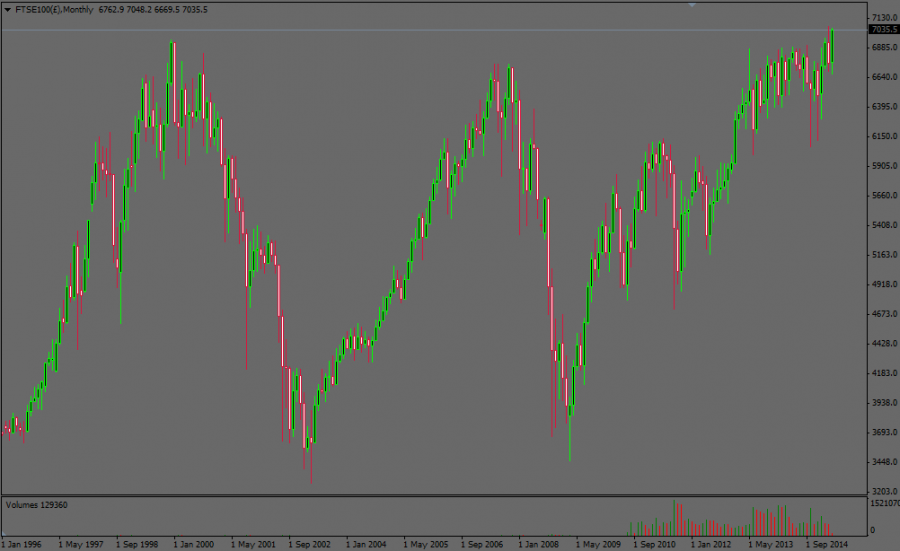
I notice a few other things on the monthly chart below
1. Abscense of a rejection spike on the price kissing the 6800 area which was seen on the last two attempts
2. Price acceptance pattern at the same area ( congestion and slight rising range )
3. Two failed downward breaks below 6100
4. New high ground reached on 9th April 2015
5. Projection based on range depth of 3500 is to add that to previous range peak giving projection of 6800 + 3500 = 10,300
6. Clearly defined "roof" to old range at 6800 level which is likely to act as support if the price goes up and re-traces to that level.
What is really paradoxical and confusing is that we are only one month away from the General election in UK on May 7th 2015. This event is being called by the polls as a 1 point lead for the conservatives with no clear result being forecast, or in other words very uncertain.
On the usual basis that stockmarkets tend to hate uncertainty and usually go down in times when there is something unknown is very very interesting.
What does it mean?
For most of my trading memory this index has been rangebound between 3500 and 6800 while many other world barometer indices has been enjoying the freedom of regular new high ground.
Talking to Robert Newgrosh of Newskills a while back he told me he has a long term target of 10,000 for this market based on his method of projections using point and figure charts and a formula which was I believe developed by himself and / or Jeremy Du Plessis of Indexia research. Both men are very good technicians and have done much work to enhance charting methods using point and figure charts.
I notice a few other things on the monthly chart below
1. Abscense of a rejection spike on the price kissing the 6800 area which was seen on the last two attempts
2. Price acceptance pattern at the same area ( congestion and slight rising range )
3. Two failed downward breaks below 6100
4. New high ground reached on 9th April 2015
5. Projection based on range depth of 3500 is to add that to previous range peak giving projection of 6800 + 3500 = 10,300
6. Clearly defined "roof" to old range at 6800 level which is likely to act as support if the price goes up and re-traces to that level.
What is really paradoxical and confusing is that we are only one month away from the General election in UK on May 7th 2015. This event is being called by the polls as a 1 point lead for the conservatives with no clear result being forecast, or in other words very uncertain.
On the usual basis that stockmarkets tend to hate uncertainty and usually go down in times when there is something unknown is very very interesting.
What does it mean?

|
|
Maybe the market is discounting that it already expects the conservatives to win this election?
Or maybe the market thinks Ed Miliband is going to help the economy if labour wins, so they think it is a win win situation and bullish?