|
|
PRECISION DIVERGENCE FINDER, WHY NO SELL SIGNALS?
<
I read about this indicator and your answer regarding how the indicator does not have a Bearish (top) indicator to signal market tops. This tool was primarily designed for equity markets correct? What about bonds, commodities, currencies, crude oil for example... would a bearish top version possibly work better in those markets than in equity markets that have very different patterns at highs and lows?
I understand the characteristics of equity markets compared to something with less of an upward bias over time so that tops and bottoms might behave different if you looking at a more cyclical chart of crude oil, corn, natural gas etc?
That's why I ask if there could be a bearish divergence version that might possible apply to those types of markets instead of the equity markets?
Thank you,
<
Not correct, Precision Divergence Finder was designed for any market with real volume information.
The critical thing here is that you missed the point.
It has nothing to do with the markets the indicator is applied to but the relevant point is that selling is caused by a different set of emotions than buying, thus leaving a different fingerprint on the charts.
The same emotional behavior is present when people buy futures in Bonds, Oil or gas just the same as they would buy equities as they expect or hope the price will go up.
The sell offs in the the markets you mention are just as unpredictable as they are in equities because often ( but not always ) they are driven by fear of losing, fear of giving back profit, or worse.
Frequently these are rapid and come without any prior warning or tell tales technical signs. Such activity is not going to be seen easily by technical indicators.
So in a a nutshell, if a model is created and tested and not found to be an efficient tool then I don't make it into a product to sell on my site.
The buy signals it generates however are much more reliable and you will find this is the case with many technical analysis tools, for the exact same reasons stated above.
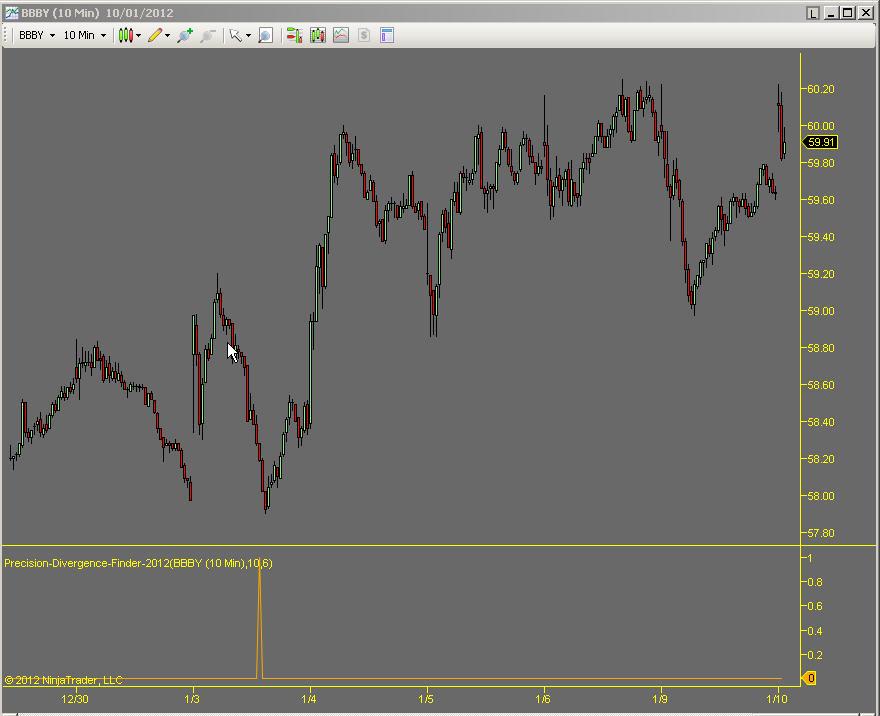
The image below shows a clear and precise detection of a bullish divergence which lead to a large move up.

