|
|
PI-OSC SAW TOOTH PLOT QUESTION
<
Good morning Roger,
I started to use on experimental basis your indicator, needless to tell you although my knowledge on Computers is extremely limited, the set up was very easy following your instructions.
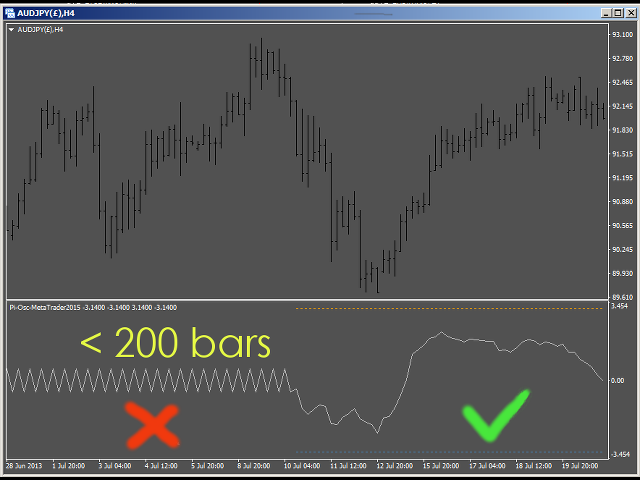
I notice that on daily data the oscillator is working in the area of +3.14 and -3.14 for a period of 2 and half months . backwards in the whole area around the -0 line ,there is a line with teeth like a saw. On weekly data the oscillator oscillates for a period of 14 months ( Weekly data ) and thence backwards
Is the line with teeth like a saw in the 0 area .
As I am first time user please can you tell me if this is normal for the indicator .
With intra day data for example 60 minutes it oscillates normally for a period over 100 days in the area of +3.14 and -3.14.
I would appreciate very much if you tell me if this is normal particularly with daily and weekly data . With monthly data is not working , only a line in the 0 area appears with saw teeth. By the way if there is something that will need my attention please let me know.
Best regards,
<
The saw tooth plot was to show users that less than 200 bars are loaded as this indicator needs 201 bars to start.
You need to load more data to see more of the chart, you can do this by clicking on instrument, properties, bars loaded.

